The Form of After Life
In several Asian cultures, incense sticks play a significant role in ancestral rites—ceremonies that honor and remember deceased ancestors. The burning of incense serves as a symbolic offering, with the rising smoke believed to act as a bridge between the living and the spirit world, carrying prayers, thoughts, and respect to those who have passed. In this sense, incense becomes a poetic and tangible connector between the present and the past, the physical and the spiritual.
Inspired by this symbolism, I thought it would be interesting to explore how the smoke from incense moves and transforms in space. By observing the patterns and flows of incense smoke through an infrared thermal sensor connected to an Arduino, I hoped to capture the unseen dynamics of heat and motion that occur as the incense burns. While smoke itself is not always visible in infrared, the heat emitted during combustion and the temperature differences in the air currents might reveal subtle, ephemeral traces of these invisible connections.

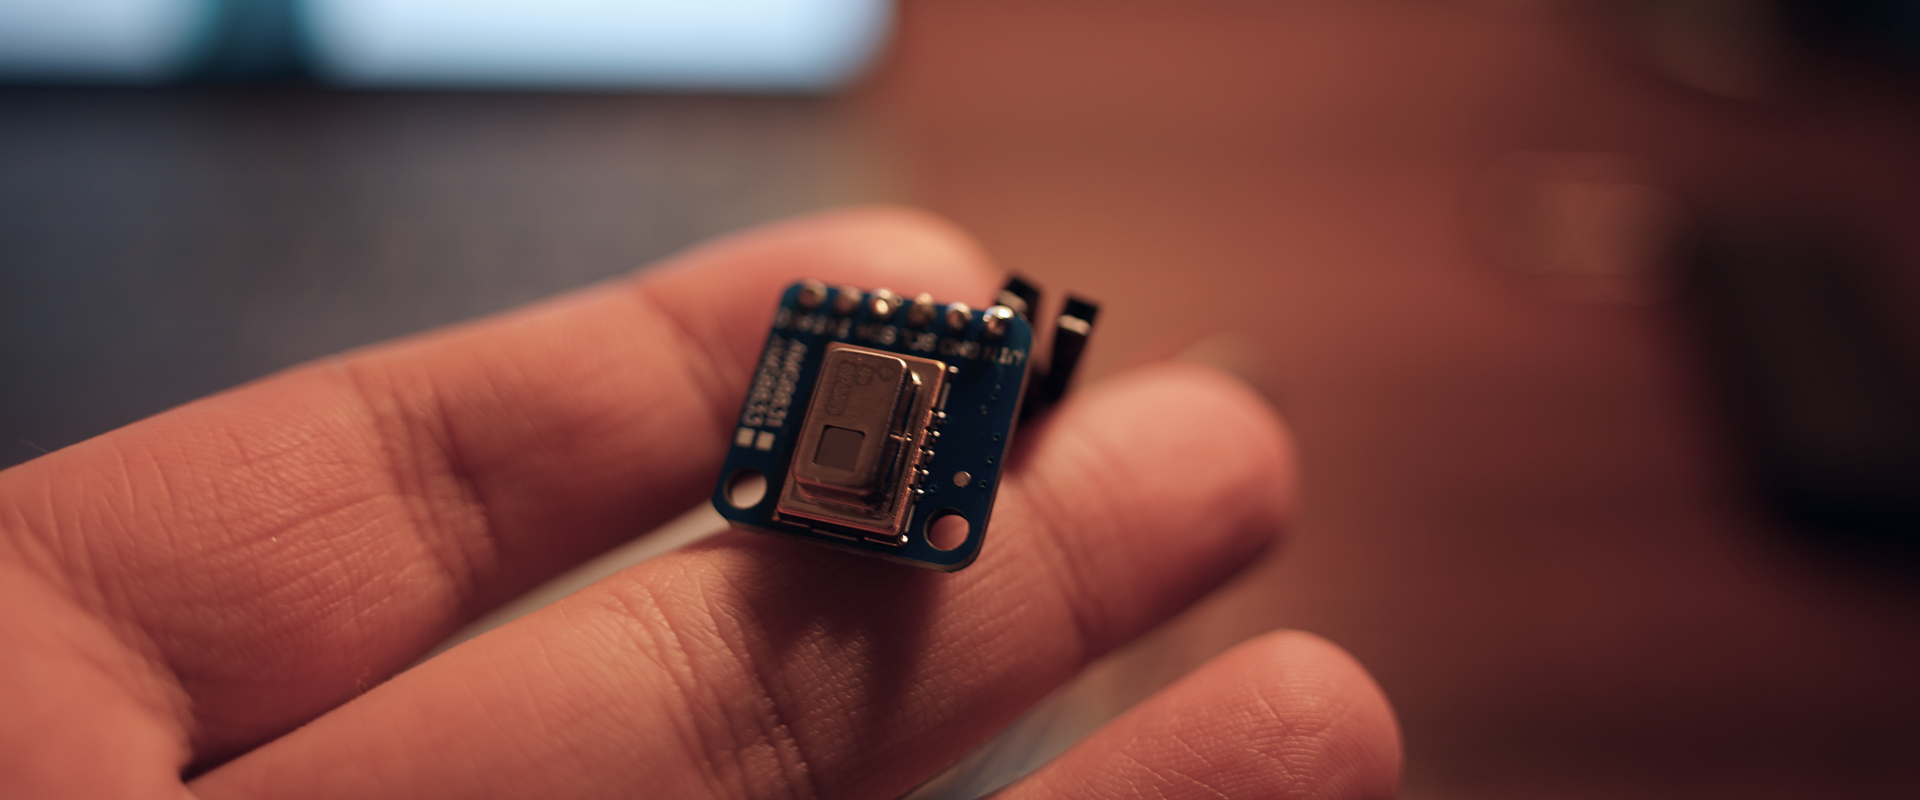
I used an AMG8833 infrared sensor. For the Arduino code, I used Adafruit’s library for the AMG8833, and followed their instructions for parsing data from Arduino to PC. Since I didn’t have an LCD panel for Arduino, I used an LLM(Claude 3.5) to code the Python script to visualize the parsed array to my laptop.
					# Code generated by Claude3.5 for visualizing the array from AMG8833

import serial
import numpy as np
import matplotlib.pyplot as plt
from matplotlib.animation import FuncAnimation
from matplotlib.colors import LinearSegmentedColormap
import glob
import time

def find_arduino_port():
    """Try to find the Arduino port."""
    # Common patterns for Arduino ports on different operating systems
    patterns = [
        '/dev/cu.usbmodem*',  # macOS
        '/dev/ttyUSB*',       # Linux
        '/dev/ttyACM*',       # Linux
        'COM*'               # Windows
    ]

    for pattern in patterns:
        ports = glob.glob(pattern)
        if ports:
            return ports[0]
    return None

def connect_to_arduino(port, baud_rate):
    """Try to connect to Arduino with error handling"""
    try:
        # Close port if it's open
        try:
            ser = serial.Serial(port)
            ser.close()
        except:
            pass

        # Wait a bit before reopening
        time.sleep(1)

        # Open port with explicit settings
        ser = serial.Serial(
            port=port,
            baudrate=baud_rate,
            bytesize=serial.EIGHTBITS,
            parity=serial.PARITY_NONE,
            stopbits=serial.STOPBITS_ONE,
            timeout=1,
            write_timeout=1
        )

        # Clear any leftover data
        ser.reset_input_buffer()
        ser.reset_output_buffer()

        return ser
    except Exception as e:
        print(f"Error connecting to Arduino: {e}")
        return None

# Configure the serial connection
BAUD_RATE = 115200

# Try to find the Arduino port
print("Looking for Arduino...")
SERIAL_PORT = find_arduino_port()

if not SERIAL_PORT:
    print("No Arduino found. Please:")
    print("1. Make sure your Arduino is connected")
    print("2. Check if the Arduino IDE can see the board")
    print("3. Make sure you have the correct permissions to access the port")
    exit(1)

print(f"Found Arduino at {SERIAL_PORT}")

# Try to connect to Arduino
ser = connect_to_arduino(SERIAL_PORT, BAUD_RATE)
if not ser:
    print("Failed to connect to Arduino")
    exit(1)

print("Successfully connected to Arduino!")

# Create figure for plotting
fig, ax = plt.subplots(figsize=(8, 8))
plt.ion()

# Set fixed temperature range for consistent color mapping
MIN_TEMP = 15   # Minimum temperature (dark blue)
MAX_TEMP = 30   # Maximum temperature (red)

# Create a custom colormap from blue to red
colors = ['darkblue', 'blue', 'cyan', 'yellow', 'orange', 'red']  # Removed darkred since 30°C is now max
n_bins = 256  # Number of color gradations
custom_cmap = LinearSegmentedColormap.from_list("custom", colors, N=n_bins)

# Create a higher resolution grid for interpolation
x = y = np.linspace(0, 7, 64)
xx, yy = np.meshgrid(x, y)

# Initial setup of the plot with custom colormap
initial_grid = np.zeros((64, 64)) + MIN_TEMP  # Initialize with minimum temperature
im = ax.imshow(initial_grid, cmap=custom_cmap, interpolation='gaussian',
               vmin=MIN_TEMP, vmax=MAX_TEMP)

# Add colorbar with temperature labels
cbar = plt.colorbar(im, ax=ax)
cbar.set_label('Temperature (°C)')

# Create temperature tick labels with 3-degree steps for more detail
temp_range = np.arange(MIN_TEMP, MAX_TEMP + 1, 3.0)
cbar.set_ticks(temp_range)
cbar.set_ticklabels([f'{t:.0f}°C' for t in temp_range])

# Remove axis ticks and labels for cleaner look
ax.set_xticks([])
ax.set_yticks([])

# Initial title with min/max markers
title = ax.set_title('AMG8833 Thermal Camera')

# Tight layout to prevent text cutoff
plt.tight_layout()

def interpolate_grid(grid):
    """Interpolate 8x8 grid to 64x64"""
    from scipy.interpolate import griddata

    # Create coordinates for original 8x8 grid
    x_orig, y_orig = np.meshgrid(np.linspace(0, 7, 8), np.linspace(0, 7, 8))
    points = np.column_stack((x_orig.flatten(), y_orig.flatten()))

    # Create coordinates for 64x64 grid
    x_new, y_new = np.meshgrid(np.linspace(0, 7, 64), np.linspace(0, 7, 64))

    # Interpolate
    return griddata(points, grid.flatten(), (x_new, y_new), method='cubic')

def update_plot(frame):
    try:
        # Read serial data
        if ser.in_waiting:
            line = ser.readline().decode('utf-8').strip()

            # Skip empty lines and startup messages
            if not line or not ',' in line:
                return

            # Convert the comma-separated string to a list of floats
            try:
                temperatures = [float(x) for x in line.split(',') if x]

                if len(temperatures) == 64:  # We should have 64 pixels
                    # Reshape into 8x8 grid
                    grid = np.array(temperatures).reshape(8, 8)

                    # Flip the grid horizontally for mirror effect
                    grid = np.fliplr(grid)

                    # Interpolate to 64x64
                    grid_hires = interpolate_grid(grid)

                    # Update the image data
                    im.set_array(grid_hires)

                    # Update min/max values
                    current_min = np.nanmin(grid)
                    current_max = np.nanmax(grid)

                    # Add min/max markers to corners
                    title.set_text(f'▼{current_min:.1f}°C    ▲{current_max:.1f}°C')

            except ValueError as e:
                print(f"Error parsing values: {e}")
                return

    except Exception as e:
        print(f"Error reading data: {e}")
        return

# Set up animation
print("Starting visualization... (Press Ctrl+C to exit)")
ani = FuncAnimation(fig, update_plot, interval=1000, cache_frame_data=False)  # Changed to 2000ms (2 seconds)
plt.show(block=True)

# Cleanup when closed
ser.close()


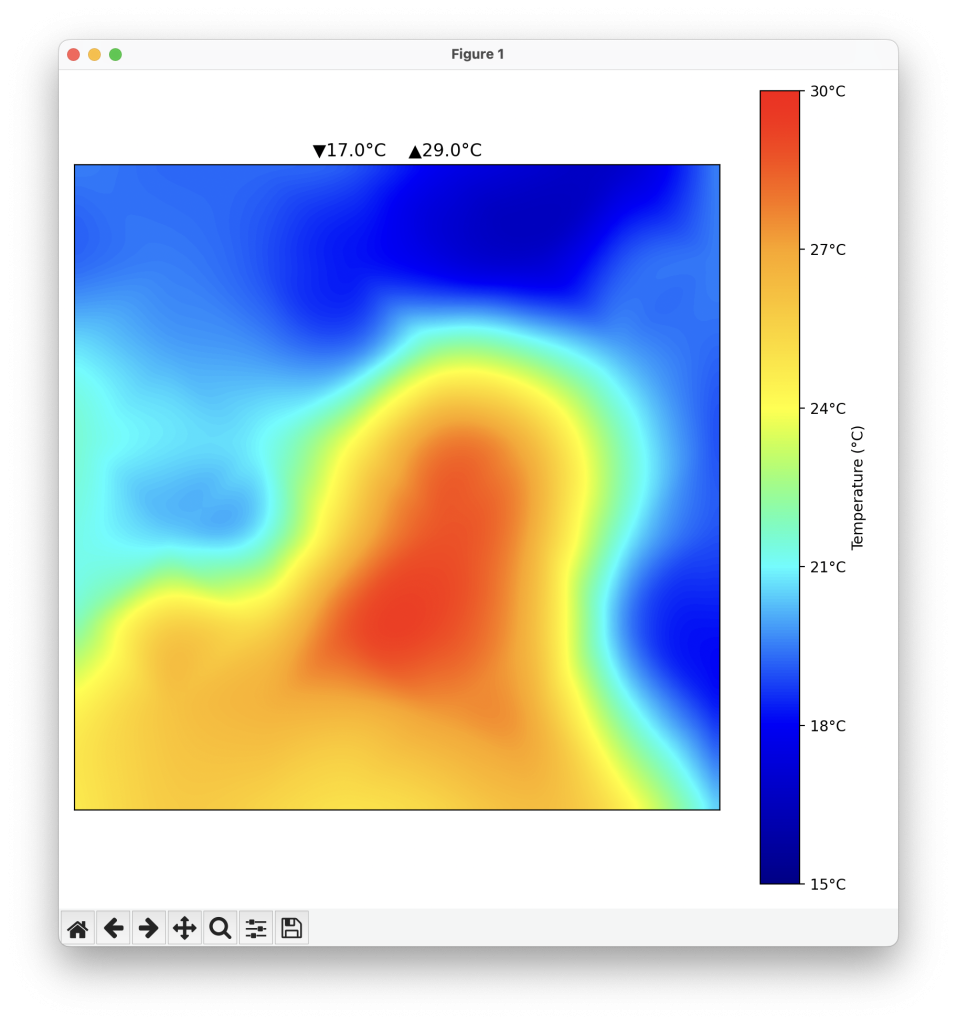
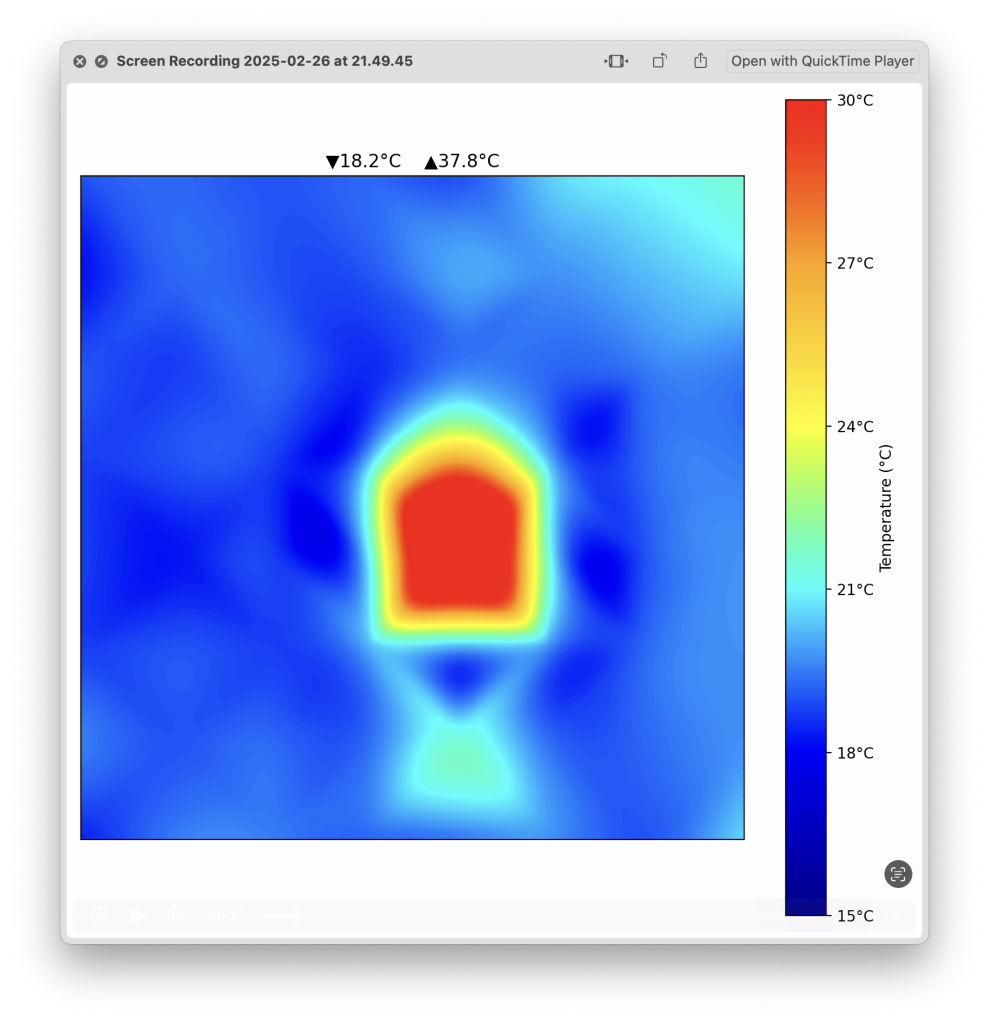
The results of this project did not turn out as I expected. The AMG8833 thermal sensor was not able to capture the subtle heat of an incense stick or cone with enough precision or quality to visualize the movement of the smoke. In the image on the left, the Python program running on a PC successfully detects the heat of a human body. However, on the right, you can see the capture of an incense cone, which barely portrays any meaningful insights. The results were similar when testing with an incense stick.
Although the results weren’t as anticipated, the concept of connecting the living and the deceased through incense sticks could be used in other methods. After this experiment, I also tried filming incense smoke using the slow motion function on a mobile phone. The smoke seemed to flow in different directions depending whether it was a stick or a cone. The smoke also portrayed the controlled repetitiveness and uncontrolled repetitiveness that I was looking into.